When your main app is running via Visual Studio, when there is a problem you’ll get an exception and Visual Studio will break into the debugger to help you figure out the problem.
There’s a couple of scenarios that are a little more difficult to debug but are easy enough to do once you know how to access it in Visual Studio.
The two things that can be problematic are debugging background agents and debug share to functionality if your app is a share target. If you share to your app if it’s not already running you may not have things like dependency injection registered or other setup code. This is because a differnt code path executes when you launch the app normally to when you launch via share charm. The other thing is debugging background agents, if you are (for example) using a timed agent that executes every hour you don’t want to wait around for an hour before you can test.
Debugging Apps Launched from Share Charm
This technique also applies if you want to start debugging when you start your app from the desktop, even if you didn’t start it from Visual Studio.
Make sure your app is built and deployed: if you just want to deploy but not launch go to the Build menu and choose Deploy Solution.
At this point your app is freshly installed but is not running.
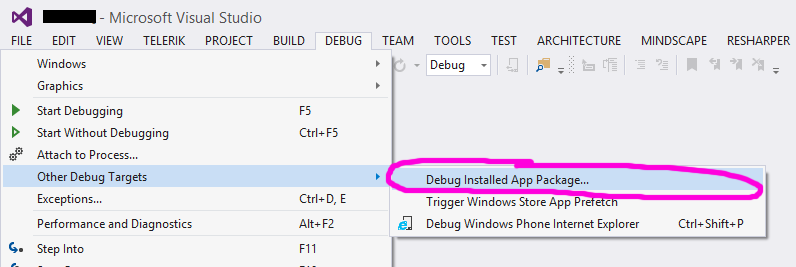
Go to the Debug menu and choose Other Debug Targets then Debug Installed App Package as shown in the screenshot below.

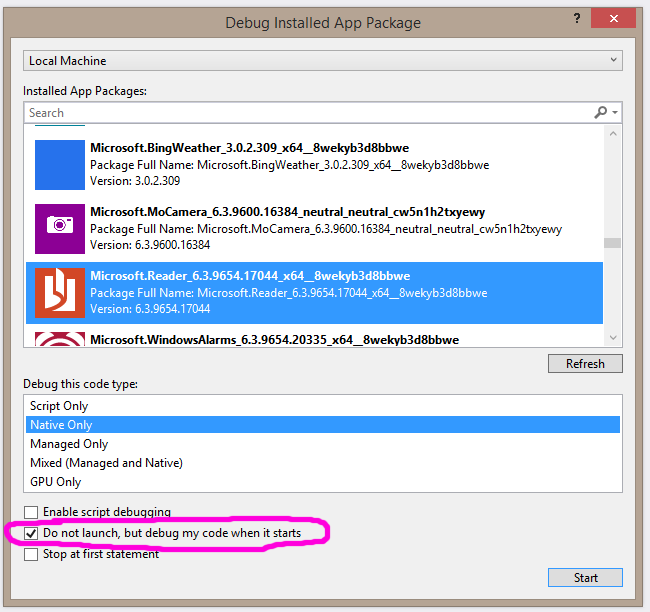
Choose your app from the list and make sure the “Do not launch, but debug my code when it starts” option is ticked as the following screenshot shows.

Then click Start.
Now go to another app and initiate a share to your app. Your app will launch and the debugger will attach, allowing you to break into code if share to is causing an exception.
Debugging Windows Store Background Agents
To manually cause a registered background agent to run for your app. Start debugging your app from Visual Studio as normal. Once your app has registered your background agent, switch back to Visual Studio.
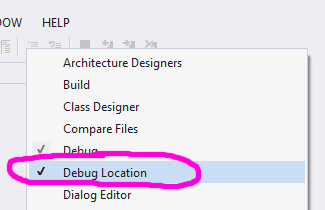
Ensure the Debug Location toolbar is visible:

Then head over to the Lifecycle Events drop down, open it and you’ll see you background agent listed (occasionally I’ve had to open the drop down twice to see the agent…). Then just click on the name of your agent and it will execute allowing you to debug it.
SHARE: